


Search

Search
Certifications
News & Events
3-A Knowledge Center

Soon, 3-A SSI will reveal winners of the 2026 Dr. Ron Schmidt Student Travel Award. In 2025, eight students were named recipients of the award, attending the 3-A SSI 2025 Summit on Hygienic Design and presenting poster sessions on their areas of study. This paper is the seventh of eight submited by the 2025 winners.
DanielaR. Chavez-Velado1, Mindy M. Brashers1, Marcos X.Sanchez-Plata1.
1International Center for Food Industry Excellence (ICFIE), Texas Tech University, Lubbock, Texas, United States.
Introduction: Listeria monocytogenes causes Listeriosis, a serious foodborne illness of concern to pregnant women, neonates, the elderly and immunocompromised individuals. Annually in the U.S. an estimate of 1,600 people is infected with Listeria and 260 people die from the infection[1]. Facilities implement environmental monitoring programs to verify that their safety plans are effectively preventing harborage of Listeria in the production environment and reduce the risk of cross-contamination and adulteration of their products[2]. Further processing facilities require detailed understanding of microbial dynamics across the production chain. This study aimed to establish facility-specific microbial baselines for Listeria spp. and total aerobic counts, identify potential harborage sites, and assess sanitation effectiveness over multiple days of production.
Bio-mapping: To evaluate the effect of the processing stages a total of six locations were selected to take sentinel samples: Raw-Marinated, After-Oven, Before-Freezer, After-Freezer, J.Scoop-Before-Bagger, and Rework. Samples were taken at 2, 5,and 10 hours into the shift over five production days. Approximately 10 g of product was collected, placed in Whirl-Pak® [3] bags, and sent to the ICFIE lab. Each sample was mixed with 90 mL Buffered Peptone Water (BPW), [4] homogenized, and analyzed for Total Count using Hygiena’s MicroSnap® (AOAC-RIPTM) [5]. Results were expressed in LogCFU/mL. The remaining sample was incubated (35 °C, 22–28 h), then analyzed for Listeria spp. DNA using HygienaBAX® System real-time PCR (AOAC-RI) [6]. Results were reported as negative or presumptive positive.
Enviro-mapping: Environmental swabs were taken from five contact surfaces: Belt-After-Oven, Belt-Before-Freezer, J.Scoop-After-Freezer, After-X-Ray-Belt, and J.Scoop-Before-Bagger, three times daily across five days. MicroTally® swabs [7] were used to swab 1 minute per side. Swabs were sent to the lab, mixed with 175 mL BPW, and analyzed using the same protocols for total counts and Listeria detection.
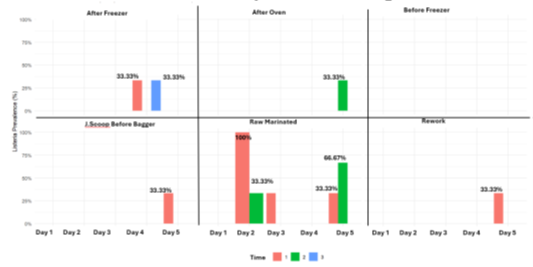
Listeria spp. Bio-mapping results: No positives were detected on Day 1, suggesting a clean production start. However, the most positives appeared at Time 1 (2 hours in), pointing to early-shift contamination risk [8,9]. Raw-Marinated samples had the highest Listeria presence (100% on Day 1; 33.33% Day 2; 66.67% Day 5), indicating persistent contamination in this area [10]. No positives were found Before-Freezer, and only one in Rework. Two positives After-Freezer suggest sporadic post-freezing contamination [11]. A single positive After-Oven (Day 3, Time 2) indicates potential post-lethality contamination. One positive at J.Scoop-Before-Bagger (Day 4, Time 1) may be due to personnel or equipment contamination before packaging.
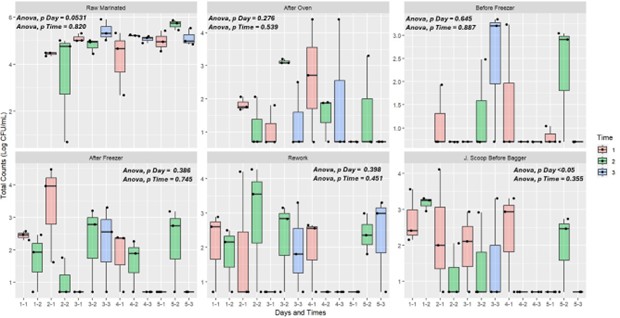
Total counts Bio-mapping results: Raw-Marinated had the highest total counts (mean 4.83 LogCFU/mL), consistent with Listeria findings [10]. ANOVA showed no significant day (p =0.0531) or time (p = 0.820) effects overall, though the day effect approached significance. J.Scoop-Before-Bagger showed a significant day effect (p <0.05), indicating variable contamination possibly linked to operational changes [12]. No significant time effect was noted (p = 0.355), suggesting stable microbial loads throughout each shift.
Listeria spp. Enviro-mapping results:
On Day 1, all J.Scoop-Before-Bagger samples at Time 1 and 2 tested presumptively positive indicating early contamination that persisted through the first two timepoints [10,11]. J.Scoop-After-X-Ray showed the most consistent Listeria spp. positives throughout the 5-day sampling period. Positives were observed on Days 1, 2, 3, and 4, with 100% positivity on Day 4 at Time 3, indicating a recurring issue [8]. The Belt-After-Oven, Before-Freezer, and the Hopper did not yield any Listeria spp. positives, suggesting that these areas might not be contributing to contamination or that controls in place there are effectively mitigating risk [2]. Analysis across timepoints revealed that Time 3 had the highest occurrence of positives. This could point to increased environmental contamination as the day progresses, possibly due to residue buildup, decreased sanitation effectiveness, or handling practices toward the end of shifts [2,8,11].
Total counts Enviro-mapping results:
Significant day-to-day differences were observed at Belt-Before-Freezer and J.Scoop-After-XRay, reflecting variable sanitation or production conditions. Sampling time had no significant effect, indicating day-to-day variation had a larger impact. Time 2 (mid-shift) showed the highest number of total count spikes, while Time 3 had the highest mean counts, indicating fewer but more severe contamination events late in the day. Day 3, Time 3 had the highest total counts overall, possibly linked to equipment or sanitation failure. [11]

Join us May 4-7, 2026, in Chicago for the 3-A SSI 2026 Summit on Hygienic Design. The agenda features two tracks--advanced technical and foundational sessions--and half a day dedicated to artificial intelligence. Plus, networking opportunities at the Summit are unparalleled. You'll mingle with the people who actually write the 3-A Sanitary Standards, peers who face the same plant floor challenges as you, and students on track to be the industry leaders of the future. Learn more and register today.

3-A SSI has released a new edition of the 3-A Sanitary Standard for General Requirements, 00-02, ushering in a new era of clarity and modernization.

We’re looking for the under-40 disruptors, problem-solvers, and visionaries who look at a production line and ask, "How can we make this safer, smarter, and faster to clean?" The 3-A SSI HyGEN Excellence Awards aren't just another award. They are a career-defining launchpad. We’re building a movement to spotlight rising stars under 40 who are rewriting the rulebook.

Register free for a first-of-its-kind 3-A SSI Open Forum on Tuesday, February 10, 2026, from 12:00 to 1:00 pm.

3-A Sanitary Standards, Inc. (3-ASSI) has officially expanded its Replacement Parts and System Components Qualification Certificate (RPSCQC) program to include seals, seal components, and seal assemblies.

